Aggregate Data with Pivot Tables
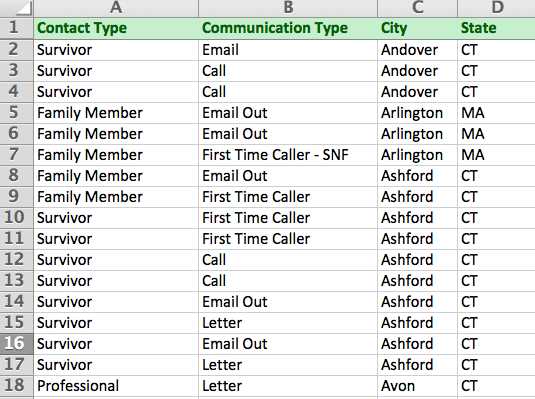
Sometimes your goal is to aggregate individual rows of data into larger groups by the same type. For example, one organization compiled a spreadsheet of its contacts. Each row included a city, and when sorted, it appeared like this:
Most spreadsheet tools include a pivot table feature to reorganize and regroup the data. While the buttons and appearances may differ across tools, the concept is the same.
Simple Pivot Table in Excel for Mac
- Select the entire sheet (click top-left box)
- Data > Pivot Tables
- Choose where to place the pivot table (default is a new sheet)
- Drag a field name into the Row Labels box (to list all of the different entries under that field).
- Drag the same field name into Values box (to display the count for each entry).
- View results of this simple pivot table. To perform any calculations, copy and paste special > values into a new sheet.
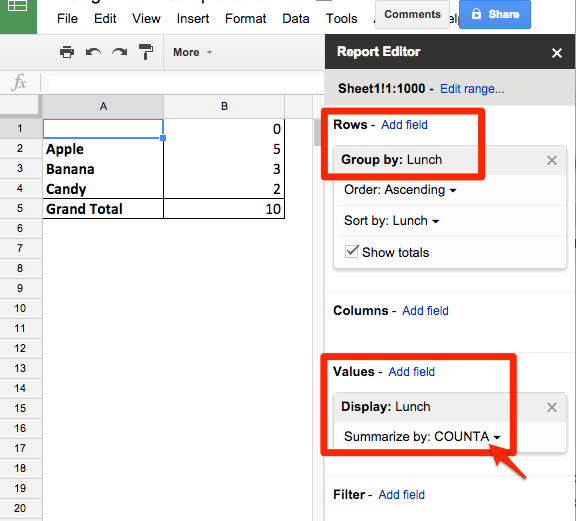
Simple Pivot Table in Google Sheets
- Select the entire sheet (click top-left box)
- Data > Pivot Tables
- In Report Editor > Rows > add a field (to list all of the entries)
- In Report Editor > Values > add same field > summarize by: COUNTA (to display the count for alphabet/textual entries)